scanpy.pl.MatrixPlot.style#
- MatrixPlot.style(cmap=no change, edge_color=no change, edge_lw=no change)[source]#
Modify plot visual parameters.
- Parameters:
- cmap
Colormap|str|None|Default(default:no change) Matplotlib color map, specified by name or directly. If
None, usematplotlib.rcParams["image.cmap"]- edge_color
str|tuple[float,float,float] |tuple[float,float,float,float] |None|Default(default:no change) Edge color between the squares of matrix plot. If
None, usematplotlib.rcParams["patch.edgecolor"]- edge_lw
float|None|Default(default:no change) Edge line width. If
None, usematplotlib.rcParams["lines.linewidth"]
- cmap
- Return type:
Self- Returns:
Examples
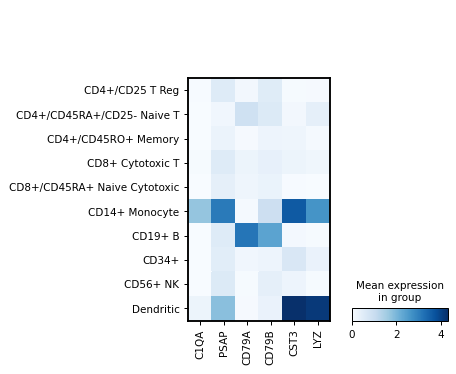
import scanpy as sc

adata = sc.datasets.pbmc68k_reduced()
markers = ['C1QA', 'PSAP', 'CD79A', 'CD79B', 'CST3', 'LYZ']
Change color map and turn off edges:
(
    sc.pl.MatrixPlot(adata, markers, groupby='bulk_labels')
    .style(cmap='Blues', edge_color='none')
    .show()
)