scanpy.pl.MatrixPlot#
- class scanpy.pl.MatrixPlot(adata, var_names, groupby, *, use_raw=None, log=False, num_categories=7, categories_order=None, title=None, figsize=None, gene_symbols=None, var_group_positions=None, var_group_labels=None, var_group_rotation=None, layer=None, standard_scale=None, ax=None, values_df=None, vmin=None, vmax=None, vcenter=None, norm=None, **kwds)[source]#
Bases:
BasePlotAllows the visualization of values using a color map.
- Parameters:
- adata
AnnData Annotated data matrix.
- var_names
str|Sequence[str] |Mapping[str,str|Sequence[str]] var_namesshould be a valid subset ofadata.var_names. Ifvar_namesis a mapping, then the key is used as label to group the values (seevar_group_labels). The mapping values should be sequences of validadata.var_names. In this case either coloring or ‘brackets’ are used for the grouping of var names depending on the plot. Whenvar_namesis a mapping, then thevar_group_labelsandvar_group_positionsare set.- groupby
str|Sequence[str] The key of the observation grouping to consider.
- use_raw
bool|None(default:None) Use
rawattribute ofadataif present.- log
bool(default:False) Plot on logarithmic axis.
- num_categories
int(default:7) Only used if groupby observation is not categorical. This value determines the number of groups into which the groupby observation should be subdivided.
- categories_order
Sequence[str] |None(default:None) Order in which to show the categories. Note: add_dendrogram or add_totals can change the categories order.
- figsize
tuple[float,float] |None(default:None) Figure size when
multi_panel=True. Otherwise thercParam['figure.figsize]value is used. Format is (width, height)- dendrogram
If True or a valid dendrogram key, a dendrogram based on the hierarchical clustering between the
groupbycategories is added. The dendrogram information is computed usingscanpy.tl.dendrogram(). Iftl.dendrogramhas not been called previously the function is called with default parameters.- gene_symbols
str|None(default:None) Column name in
.varDataFrame that stores gene symbols. By defaultvar_namesrefer to the index column of the.varDataFrame. Setting this option allows alternative names to be used.- var_group_positions
Sequence[tuple[int,int]] |None(default:None) Use this parameter to highlight groups of
var_names. This will draw a ‘bracket’ or a color block between the given start and end positions. If the parametervar_group_labelsis set, the corresponding labels are added on top/left. E.g.var_group_positions=[(4,10)]will add a bracket between the fourthvar_nameand the tenthvar_name. By giving more positions, more brackets/color blocks are drawn.- var_group_labels
Sequence[str] |None(default:None) Labels for each of the
var_group_positionsthat want to be highlighted.- var_group_rotation
float|None(default:None) Label rotation degrees. By default, labels larger than 4 characters are rotated 90 degrees.
- layer
str|None(default:None) Name of the AnnData object layer that wants to be plotted. By default adata.raw.X is plotted. If
use_raw=Falseis set, thenadata.Xis plotted. Iflayeris set to a valid layer name, then the layer is plotted.layertakes precedence overuse_raw.- title
str|None(default:None) Title for the figure.
- expression_cutoff
Expression cutoff that is used for binarizing the gene expression and determining the fraction of cells expressing given genes. A gene is expressed only if the expression value is greater than this threshold.
- mean_only_expressed
If True, gene expression is averaged only over the cells expressing the given genes.
- standard_scale
Literal['var','group'] |None(default:None) Whether or not to standardize that dimension between 0 and 1, meaning for each variable or group, subtract the minimum and divide each by its maximum.
- values_df
DataFrame|None(default:None) Optionally, a dataframe with the values to plot can be given. The index should be the grouby categories and the columns the genes names.
- kwds
Are passed to
matplotlib.pyplot.scatter().
- adata
See also
matrixplot()Simpler way to call MatrixPlot but with less options.
rank_genes_groups_matrixplot()to plot marker genes identified using the
rank_genes_groups()function.
Examples
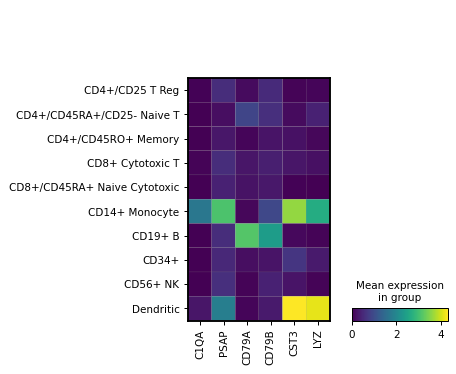
Simple visualization of the average expression of a few genes grouped by the category ‘bulk_labels’.
import scanpy as sc
adata = sc.datasets.pbmc68k_reduced()
markers = ['C1QA', 'PSAP', 'CD79A', 'CD79B', 'CST3', 'LYZ']
sc.pl.MatrixPlot(adata, markers, groupby='bulk_labels').show()
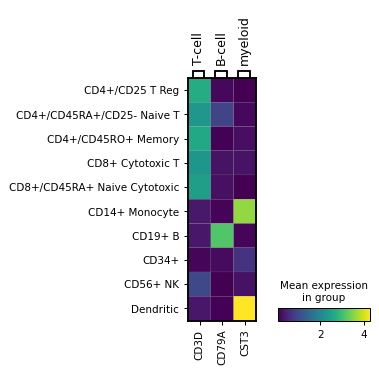
Same visualization but passing var_names as dict, which adds a grouping of the genes on top of the image:
markers = {'T-cell': 'CD3D', 'B-cell': 'CD79A', 'myeloid': 'CST3'}
sc.pl.MatrixPlot(adata, markers, groupby='bulk_labels').show()
Attributes
Methods
style([cmap, edge_color, edge_lw])Modify plot visual parameters.